Tutorial
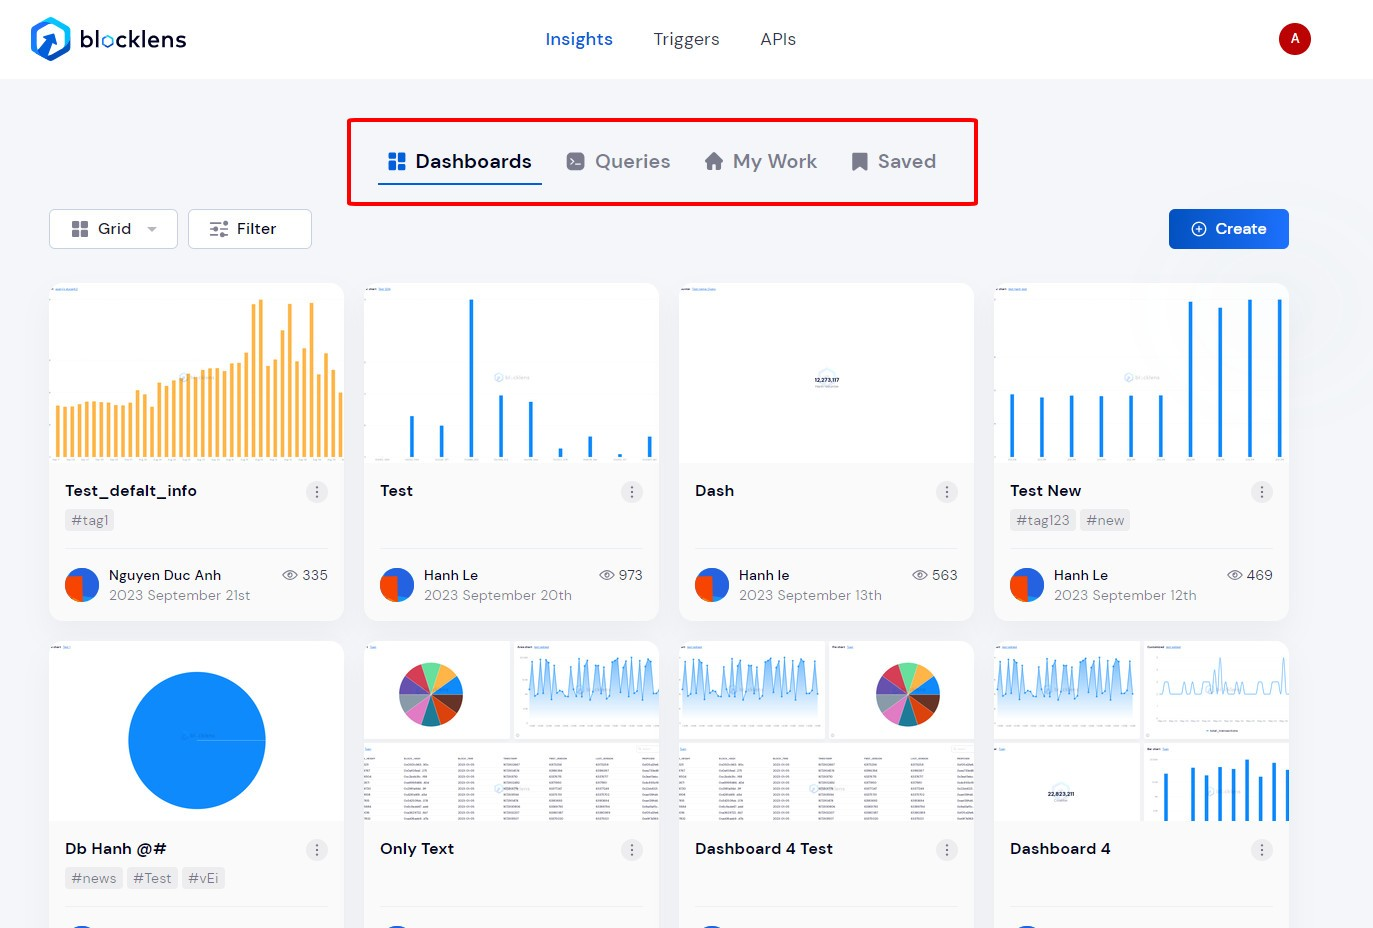
Upon selecting 'Insight' from the Navigation Menu, you'll be greeted with the following options:
- Dashboard Menu: This section exhibits all publicly available dashboards from Blocklens users, providing a comprehensive view of shared insights.
- Queries Menu: Here, users can explore a collection of public queries shared by the Blocklens community, fostering collaborative data analysis.
- My Work: A personalized space, 'My Work' displays the dashboards and queries crafted by the individual user, facilitating quick access to one’s analytical endeavors.
Query editor
The data query editor leverages BlocklensSQL, a dedicated query engine finely tuned to facilitate swift and efficient blockchain data analysis.
Query Editor Features
Composing & Running Queries
- Log in to Blocklens and locate the "Create" button.
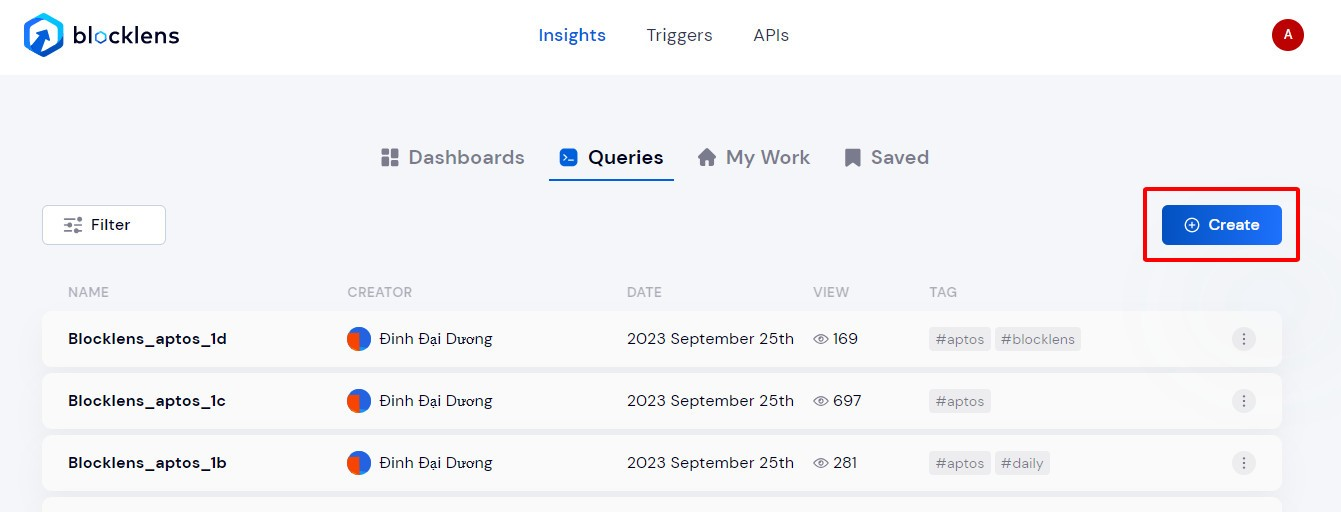
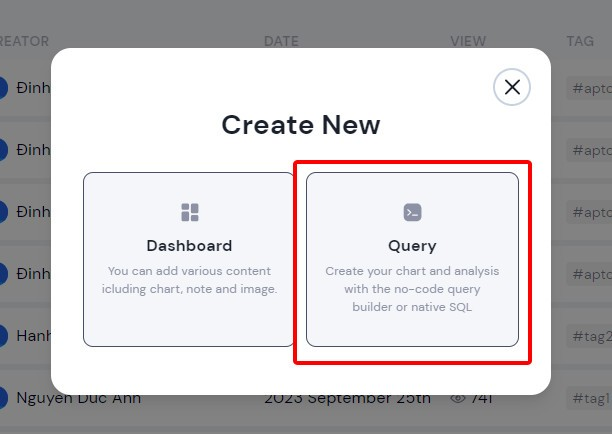
- Click "Create" to open a popup, then select "Query" to initiate a new query.
- Enter your query in the provided space. For reference or assistance, find a list of available datasets from Ethereum and Aptos on the left sidebar.
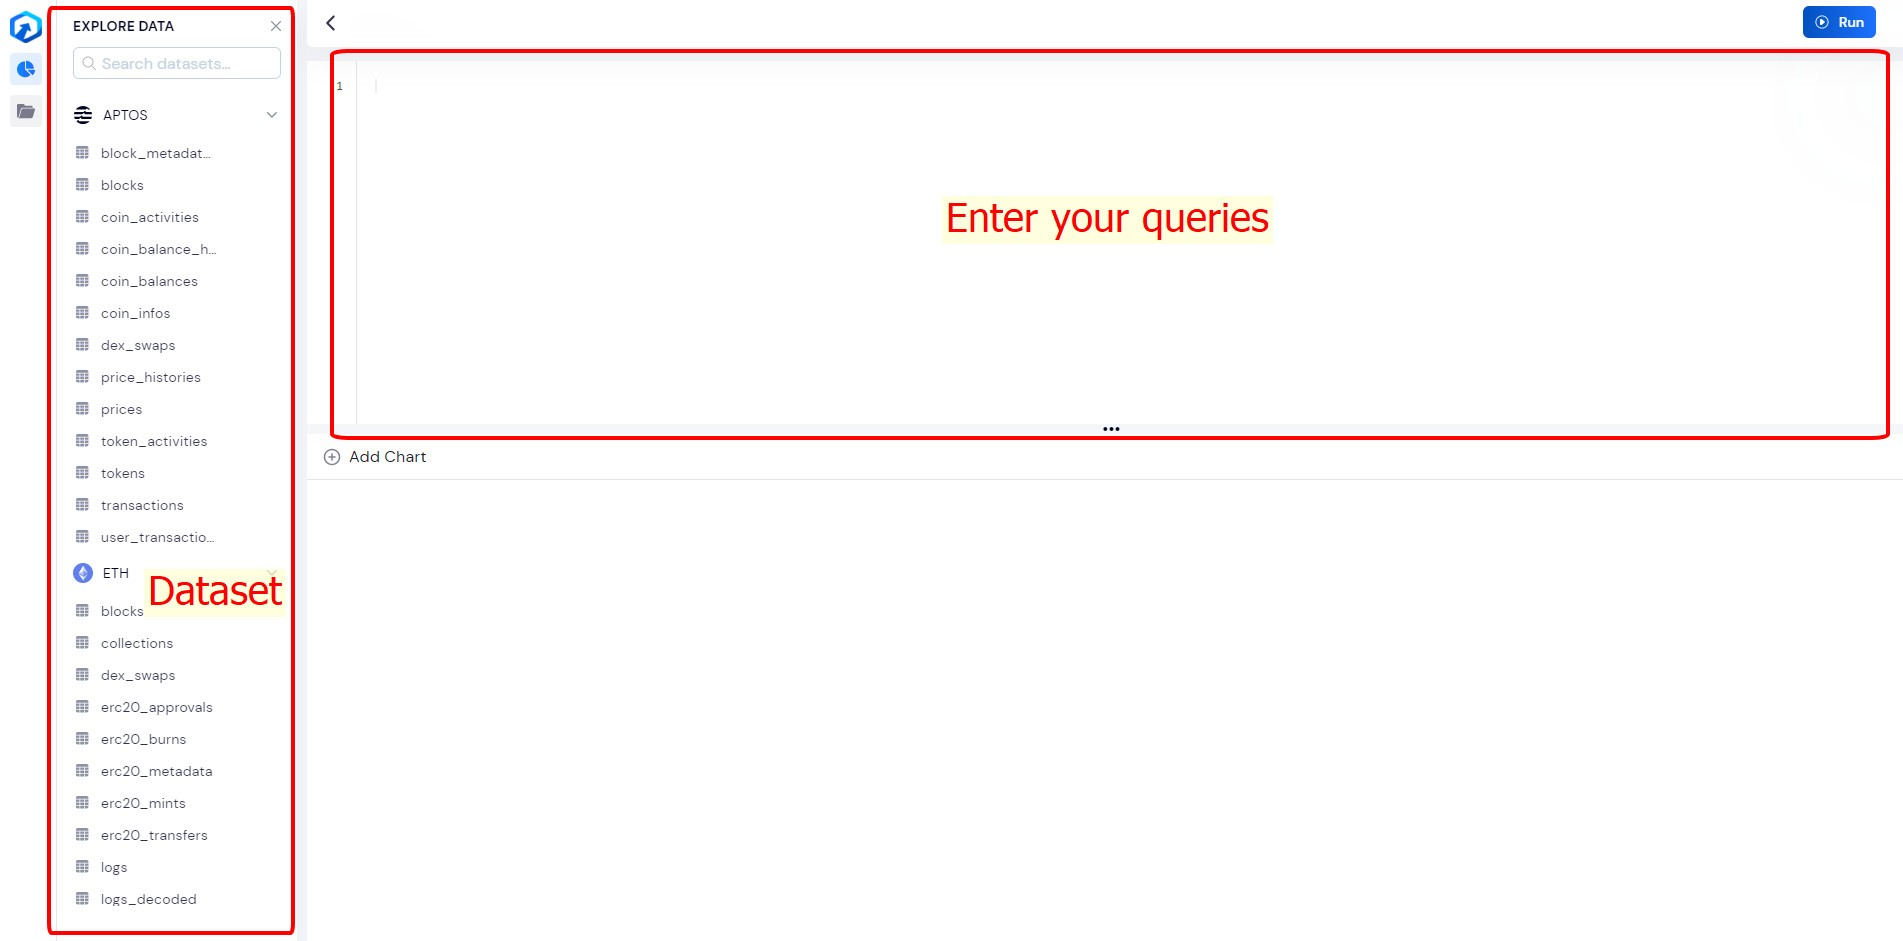
- Press "Run" to execute your query and view the results in the section below.
Forking a query
- Navigate to the "Queries" tab and select the query you wish to fork.
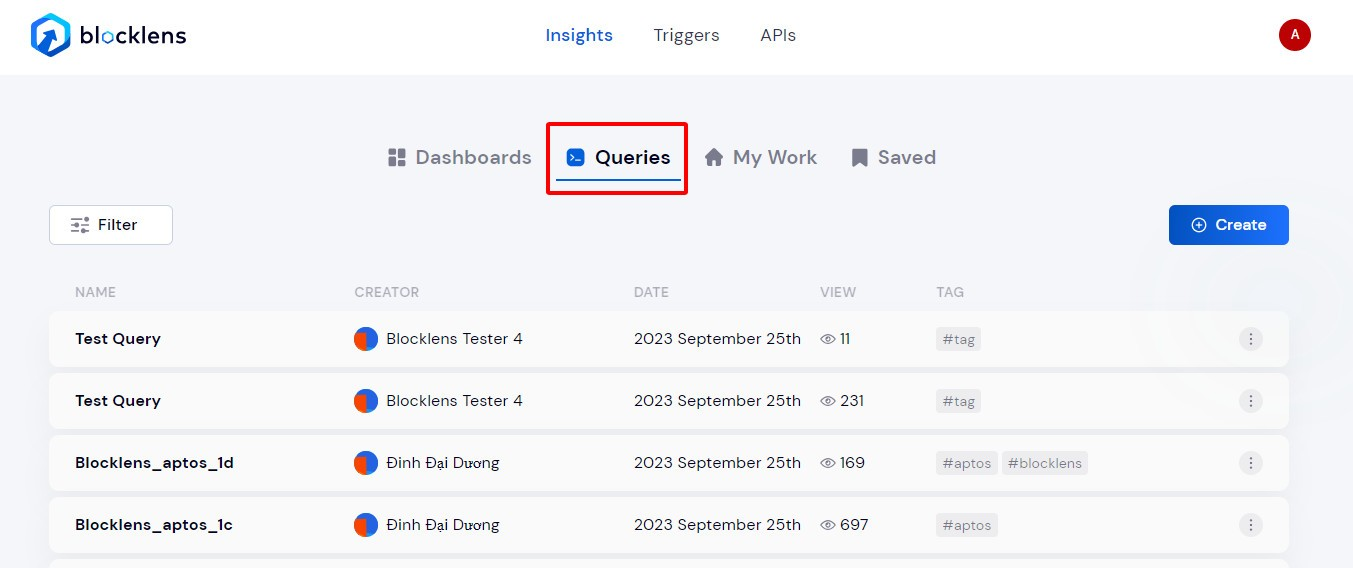
- Click the three-dot menu on the right side to open a popup, then choose "Fork" to create a derivative of the selected query.

Sharing a query
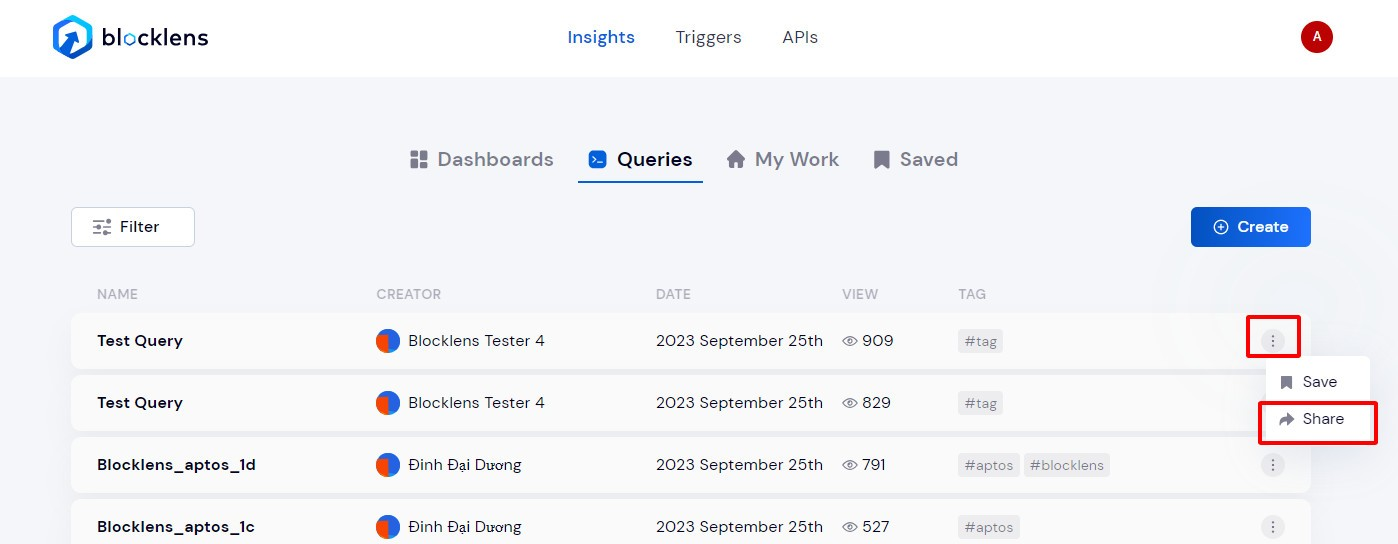
- Visit the "Queries" tab and identify the query you want to share.
- Click the three-dot menu on the right to access a popup, from where you can select "Share" to generate a shareable link.
Data visualization
Blocklens offers various intuitive options to visualize your query results, enhancing your data analysis experience:
- Table: This is the default visualization setting, automatically organizing your query results in a tabular format for easy reference.
- Charts & Graphs: Enhance your data representation with customizable charts and graphs, enabling a more visual and discernible data tracking experience.
- Counter: Opt for a counter visualization to prominently display a singular vital number derived from your query results.
Creating Visualization
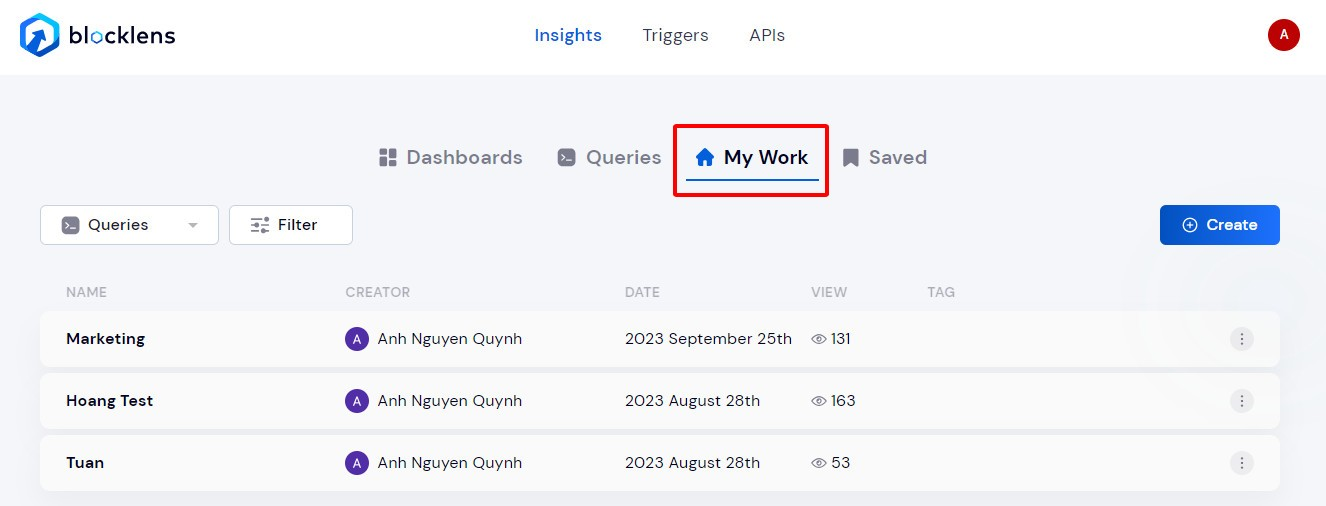
- Navigate to the "My Work" section and select the query you wish to visualize.
- In the "Result" section, click "Add chart" to open a menu where you can select your preferred chart type.
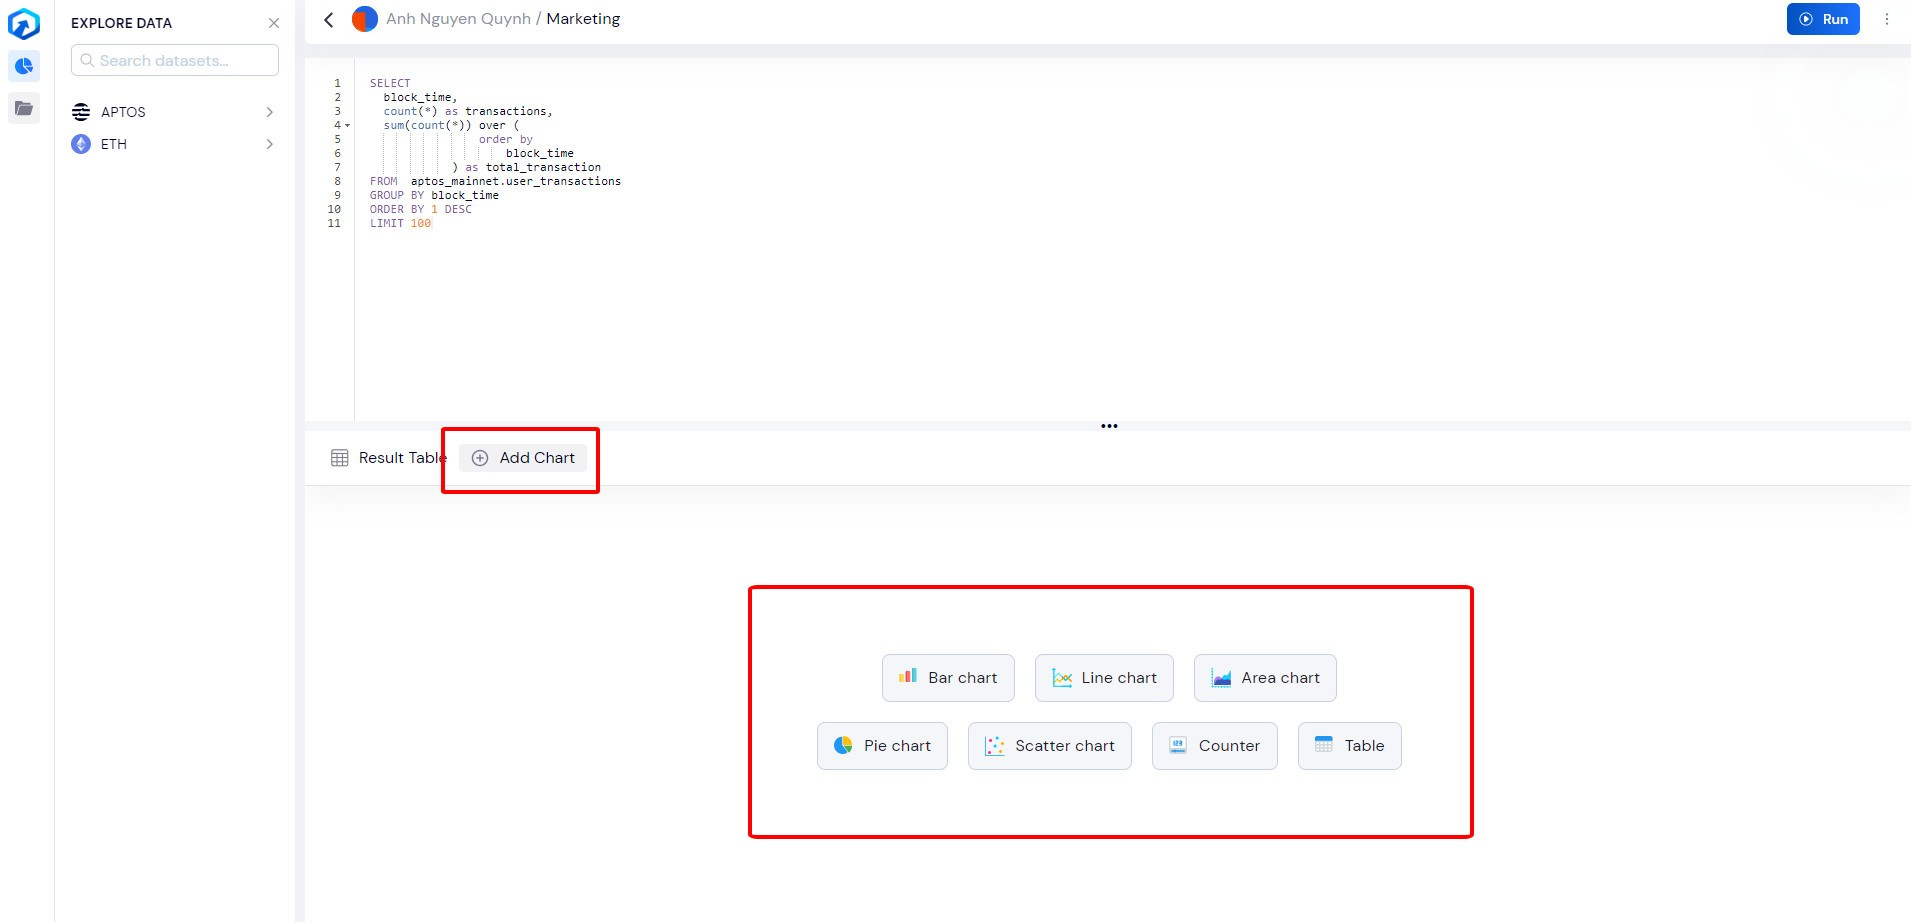
- Feel free to create multiple charts to view various perspectives of your data dynamically.
Dashboard
Dashboards are cohesive displays incorporating various widgets, including text and visualizations, which can be shared publicly. Create a dashboard using any visualizations you have crafted to convey data in a structured and visual manner.
Creating Dashboard
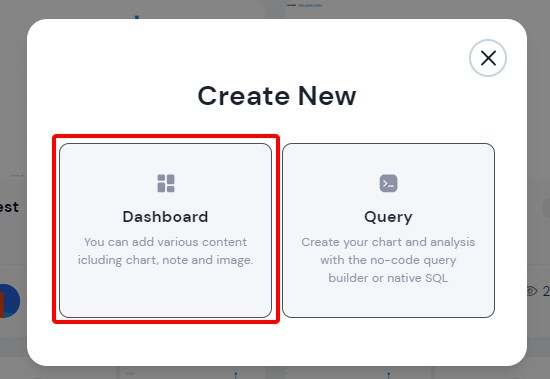
- Click the "Create" button on the main page and select "Dashboard."
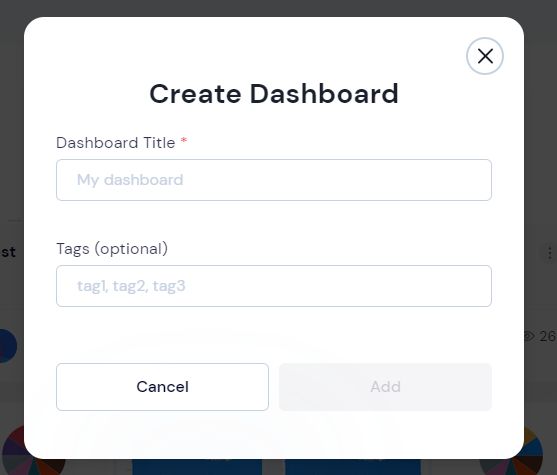
- Enter a title and tags for your dashboard to facilitate easy identification and categorization.
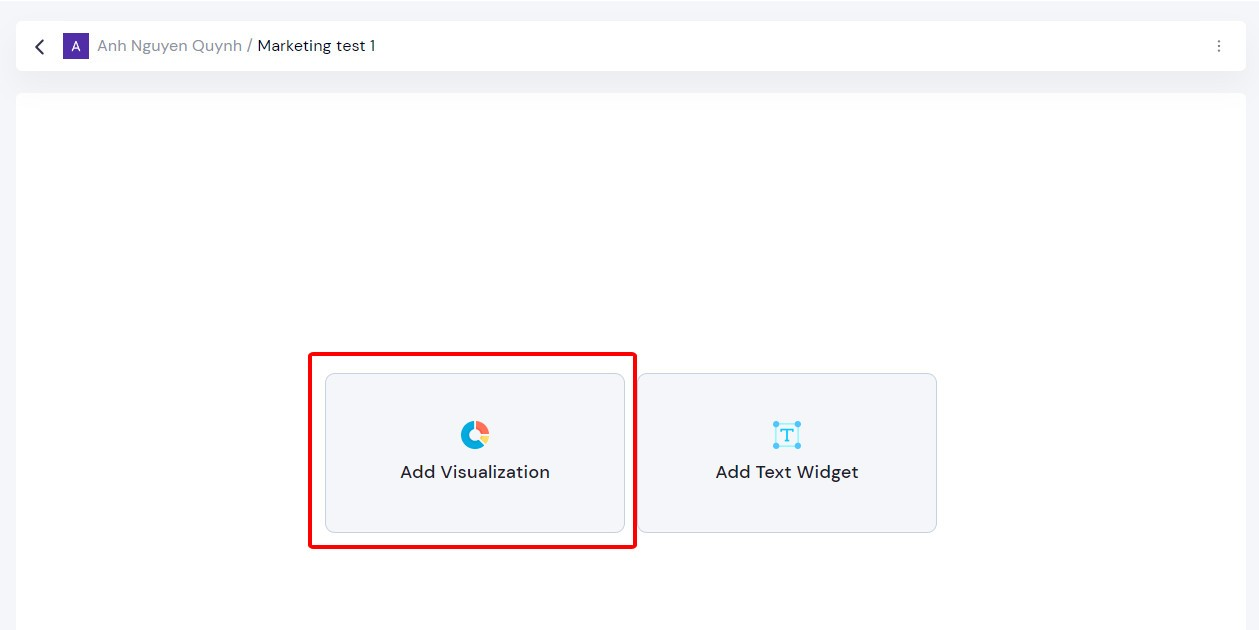
In the edit section, explore the following options to build your dashboard:
a. Visualization Widgets: - Click "Add visualization" to choose and customize the visualization widgets.
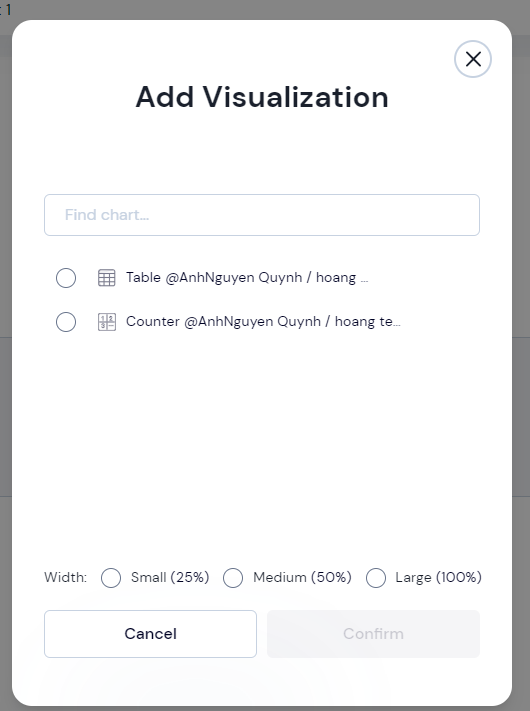
- Pick the visualization to display and select the appropriate size for a balanced display.
b. Text Widgets:
- Click "Add text widget" to integrate textual content into your dashboard.
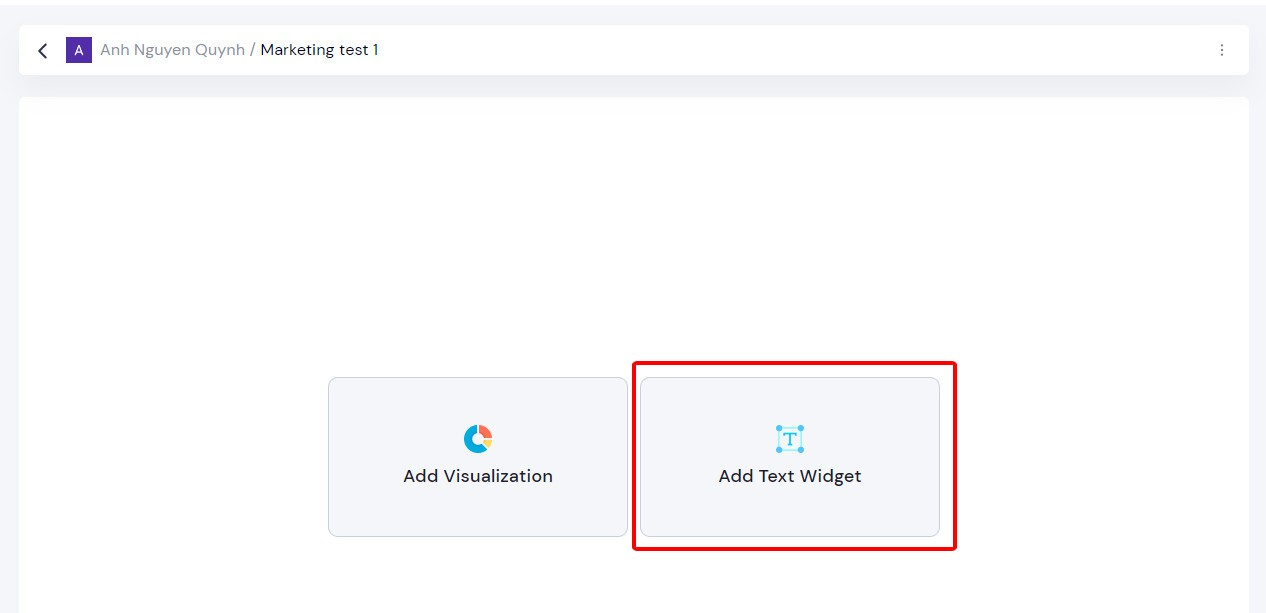
- Fill in the desired content and select a suitable size for its display.
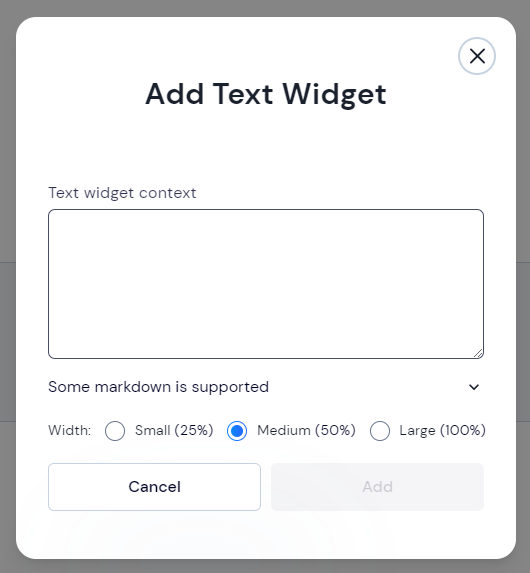
- Pick the visualization to display and select the appropriate size for a balanced display.
Resizing and Moving Widgets:
- Adjust the widget size by dragging its bottom right corner to your preferred dimensions.
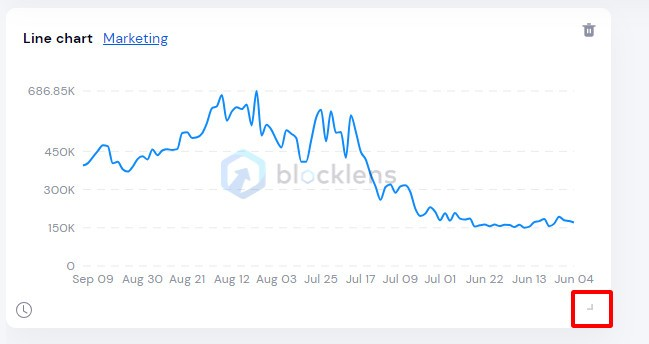
- Rearrange widgets effortlessly by dragging them to your desired location within the dashboard.